Do you want to know how many visits your website receives? Where users come from or know their demographic characteristics and interests? Even know which is the most visited page of your website? Then continue reading this post, you'll surely be interested. Welcome to the world of web analytics, welcome to Google Analytics.
What is Google Analytics?
Google Analytics is a web analytics tool that helps us analyze the sessions of a website. It's about learning and improving all the information that Google Analytics offers us through its reports.
Thanks to these reports we'll know if the content we're offering is relevant to the user or, on the contrary, is losing interest.
This way we'll be able to create and improve our marketing strategy with new actions, to retain, build loyalty and obtain conversions.
"I like it, but I don't have a Google Analytics account. What can I do?"
It's clear that if you want to use Google Analytics, you need to create an account, below I'll explain how.
Create a Google Analytics account
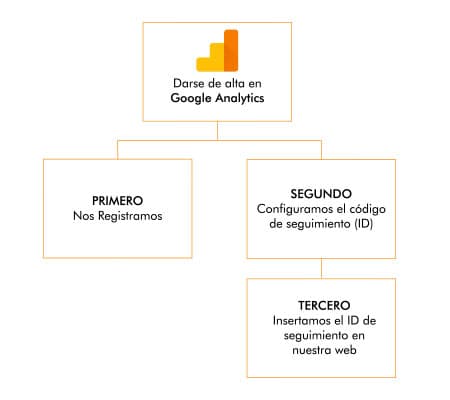
If we want to obtain data on the traffic of users who visit our website, the first thing we have to do is register on Google Analytics.
Did you know? As of July 1, 2023, Universal Analytics will stop processing data. We recommend that until the indicated date, you have the 2 Google Analytics properties (UA) and (GA4) installed on your websites and applications. Enter and discover how to install the new Google Analytics 4 property.
We'll create our account following the steps that Google Analytics indicates, it's very easy, follow me:
Important: You need to know that to create an account on Google Analytics you have to have a created Gmail account on Google.
Steps to add an account in Google Analytics
- We register at Google Analytics
- In the lower left part we will see a wheel that says administrator. We click.
- We enter the name of our account.
- It will ask us what we want to measure: web, applications or web and application. The most common case is measuring the data of a website. If this is your case, choose this option.
- If we have selected web, it's time to configure the property. We must provide the following data:
- Name of the website
- Url of the website
- Sector category to which our business belongs
- Reporting time zone
- At this point we have to accept the Google Analytics terms of service of the corresponding country or region, in my case it would be Spain. To continue, you must accept all data protection conditions.
- And finally Google Analytics will return our tracking code. We must copy and paste this is the tracking code in the first
<HEAD>element of all web pages you want to track.
How to install Google Analytics on drupal 8?
Attention! before installing the module, make a backup.
Step 1: We download the module corresponding to the drupal core version. You can download the module at Drupal Module Google Analytics
Whenever you can, choose the version recommended by the project manager, it's usually green, this ensures that there are security updates and improvements and that the module works correctly.
Step 2: We install the module.
We'll explain 2 ways to perform the installation, manual the most recommended option and via composer, for more advanced users.
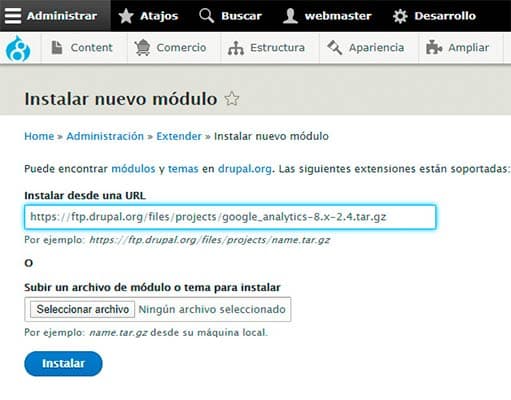
Manual installation of Google Analytics module
We copy the url of the module to install and paste it, then click the Install button:
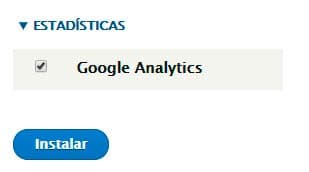
Once the module is downloaded, we have to activate it. In the "Extend Drupal" tab we search for the module, in the repository and activate it by pressing install:
Once installed, we access the module configuration which we'll find at "/admin/config/system/google-analytics" And we paste the Google Analytics ID.
The "ID" can be obtained from your own Google Analytics account "> Manage > Property > Tracking information > tracking code".
This video shows all the steps to correctly install Google Analytics on Drupal:
Google Analytics module installation for Drupal via composer
composer require drupal/google_analytics drush en -y google_analytics drush cr
How to install Google Analytics on WordPress?
Before starting it's important to make a backup of the website. Otherwise, if something goes wrong, you'll be able to restore the previously made copy.
Manual installation
- Step 1: create a Google Analytics account.
- Step 2: copy the tracking ID from your Analytics account.
- Step 3: in this case we'll install Google Analytics on a Wordpress manually so we have to have ready ftp access to our site or cPanel/Plesk access.
The first step will be to enter the file manager of our website. It can be accessed through WordPress's own theme editor, cPanel, Plesk or via FTP.
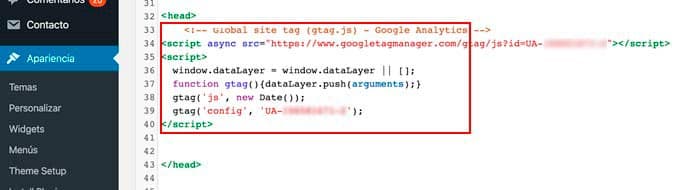
In this case I'll do it using the Wordpress theme editor, inside appearance select editor in the Dashboard sidebar.

Once inside, we have to search for the header.php file, you'll find it where it says "Templates": theme header (header.php). This file is part of WordPress core.
Inside the header.php file we'll have to search for the "<head>``</head>" tag and place the ID code that we previously copied from Google Analytics.
There's probably already some code entered, so we can paste it before or after as long as it's inside the <head> tag. It's very important that you respect the code that's inside.
Once the code is entered we can save and exit. Finally check that the code works correctly.
Installation of Google Analytics on Wordpress with plugin
Now we'll teach you how to install Google Analytics through a plugin. There are many plugins in Google Analytics, but for this occasion we'll use the "Google Analytics by Monsterinsights" plugin.
- Step 1: We go to plugins and add a new plugin.
- Step 2: In the search option we type "Google Analytics", it will return as a result some plugins related to Analytics. We activate "Google Analytics by Monsterinsights".
- Step 3: Now we'll connect the website with Google Analytics. We'll click on Click here to authenticate manually and a box will appear where we can enter our UA- XXXXXXX code,
- Step 4: Verify that the website collects Analytics data.
Open your Analytics account and choose real-time reports. Don't close Analytics, navigate your website, you'll see that you appear in the reports as an active user.
Now that you have Google Analytics installed, aren't you curious about how it works?
How does Google Analytics work?
Google Analytics uses "Cookies", which are fragments of javascript code that allow websites to track and obtain data on the activity that users perform when they visit our website or application.
All the information that Google Analytics provides us through cookies is very valuable information, since it allows us to create new marketing strategies and SEO positioning with the goal of improving our conversions on the website.
The data we collect from users through cookies are sent to the account we have created in Google Analytics. For its part, Google Analytics groups all this information for us and shows it to us through reports, once we have inserted the tracking code on all pages of the website.
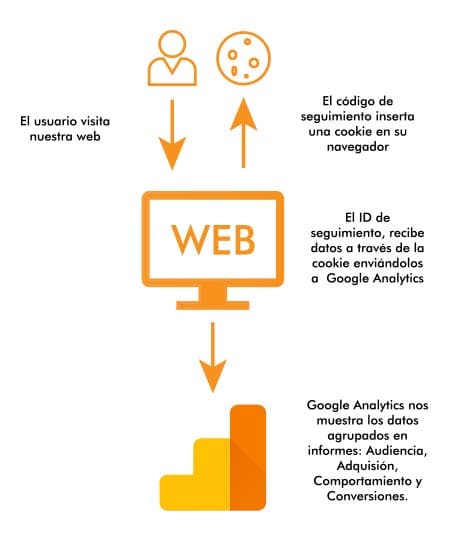
Google Analytics collects data like this:
- The user visits our website.
- The tracking code inserts a cookie in their browser.
- The tracking ID receives data through the cookie sending them to Google Analytics.
- Google Analytics shows us data grouped in reports: audience, acquisition, behavior and conversions.
How to use Google Analytics to know user behavior on your website
All the information that Google Analytics is collecting is shown through the Audience, Acquisition, Behavior and Conversions reports, as we mentioned earlier.
These reports are composed of dimensions and metrics, information that helps us understand for example a user's behavior or characteristics.
Before entering to mention what we can measure with Google Analytics we must understand the difference between dimensions and metrics.
What are Dimensions in Google Analytics?
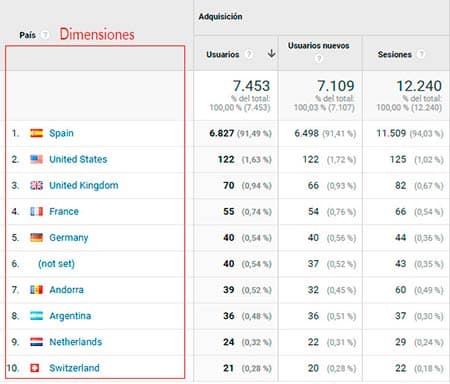
Dimensions are qualitative attributes of data that we can break down. For example we can analyze the data of our website breaking it down by the country dimension:
There are also secondary dimensions and custom dimensions.
If we analyze the url of a specific page, we could break down the information by secondary dimensions. In this example we show you the breakdown of secondary dimension by device category:
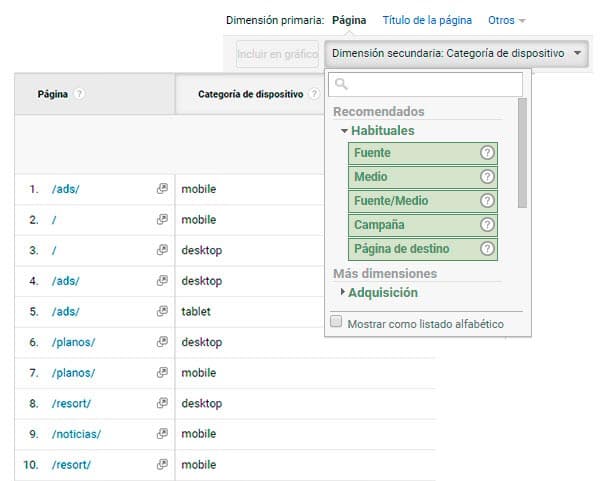
As you can see in the table, we see what type of device users are accessing our pages from. This allows us therefore to take actions to improve in case our website is not adapted for this type of devices.
You'll be interested in: KPIs to make a good digital marketing plan for your company
Types of secondary dimensions in Google Analytics:
- Device category dimension: By the type of device with which they have visited us.
- Source/medium dimension: If the traffic that reaches us is direct, organic or paid
- Campaign dimension: If you were running campaigns on Google Ads it would show us the campaign we're running.
We can find more secondary dimensions. We invite you to install Google Analytics and try the different dimension options.
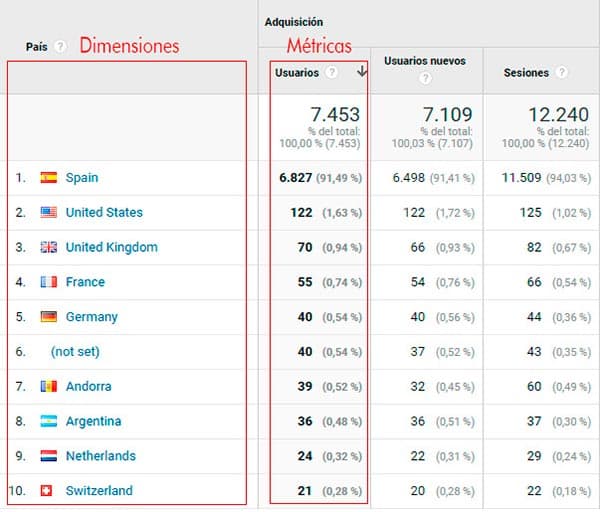
What are Metrics in Google Analytics?
Metrics could be defined as quantitative variables, which show as a value a numerical or percentage data.
Now it's time to see the main Google Analytics metrics and understand what type of information they provide us to understand how users behave on our website, what their characteristics are or where they come from when they visit us.
Main Google Analytics metrics you must control:
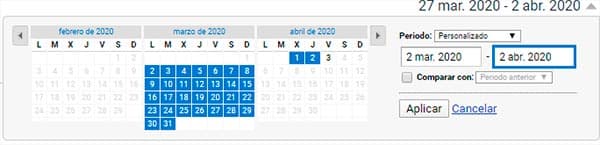
Important: Set a date range to measure the results
- Session: is the period in which a user interacts with our website or application during a time interval. The same user can perform several sessions. The end of the session ends when the user closes the browser or 30 minutes of inactivity pass on the page. That's why you must take into account the unique users metric.
- Unique visitors: To know if visitors are unique, it's done through the cookies that we install in the browser when the user accesses our site in a specific period. That is, if a user enters our website at 10:30 in the morning, generates a visit. If they re-enter with the same browser at 16, it would suppose another visit. As it's the same cookie, Google Analytics doesn't take it into account and counts it as a "unique visitor".
- Pageviews: total number of pageviews loaded in a browser. It counts the total visits a user makes on our website. If a user visits page A, then navigates to page B and returns to page A, Google Analytics will count it as one user and 3 pageviews.
- % bounce rate: Percentage of single-page sessions. It can help measure traffic quality, but careful, accompanied by other metrics like the, average time on page. The bounce rate is an overrated metric and must be treated with care. It's very common for example to find high bounce % on unique pages such as landing pages or when the user finds the information they were looking for and abandons the session from the same page. Having a high bounce % doesn't mean your page isn't of interest.
- Average session duration: The average time the user is visiting our site
Now that we know how to distinguish between dimensions and metrics, the time has come to show how Google Analytics collects all this data from the sessions users perform and groups them into different reports for us.
Google Analytics reports
Audience report
Audience reports offer us data on users who visit our website or app.
These reports that Google Analytics offers are very useful to know the characteristics of users who visit us, essential to better know what type of audience visits us.
Other data we can consult are:
- Demographic data basically comprises data on the age and sex of our visitors.
- Interests: Affinity categories, in-market segments and other categories that such users manifest with their purchasing and online travel activities.
- Geographic information: language and location of visitors.
- Behavior: in this type of report we can make comparisons between visits made by new users versus returning ones, frequency, regularity and interaction.
- Technology: what type of browser, operating system and network users use when they visit us.
- Mobile: type of device the user uses when visiting our website such as desktop, mobile and tablet.
This type of report helps us to better know our audience and make the decisions to improve the strategy as a brand.
Acquisition reports
If we want to know how users arrive at our website, acquisition reports are the ideal solution.
Thanks to them, we can know among other things whether users arrive directly or through the search engine, from which route they have accessed our website.
In addition, if we're using marketing campaigns like Google Ads, acquisition reports allow us to know their effectiveness, whether they're working for us or whether we're losing money and even which campaigns we could improve.
All this traffic is grouped into several acquisition channels (the way users access our site):
- Organic Search (search engine)
- Direct (users who type the domain directly)
- Referral (referring domains)
- Paid Search (marketing campaigns)
- Social (social networks)
- Affiliates (affiliates)
- Display (marketing campaigns)
Which acquisition reports should we consult?
- All traffic: Gives us an overview of the traffic that reaches us through the main channels.
- Google Ads: To receive this type of report, you must have the Google Ads account linked with Google Analytics. Once linked, you'll receive information about the campaigns you're using and their performance: Clicks, cost, cpc, users sessions, page behavior and conversions.
- Search Console: To receive information from Search Console in Google Analytics the first thing you must do is link both accounts, this way the data you receive in search console you'll be able to control from analytics. Search Console is a tool mainly oriented to SEO positioning. It serves us among other things to know if our SEO strategy is working correctly, since it offers information about the keywords that users have used to access our pages.
- Social Media: this type of report serves to know the visits that come from Social Networks and the interaction we've had.
- Campaigns: Offers us information of any campaign or marketing action that we're doing, like Google Ads, Facebook Ads or Instagram Ads.
Behavior reports
This type of reports offered by Google Analytics helps us understand how users interact on our website.
There are some metrics that will help us draw conclusions and assess the quality of the session, such as the number of pages viewed per session, average session duration, bounce rate, new users and other interesting metrics.
What behavior reports we can consult:
-
Site speed: Shows the page load speed. With this information we can improve our content strategy and thus retain and build loyalty with the user (it's important to offer relevant content).
-
Site search: is used mainly in ecommerce-type websites and digital media since it evaluates the searches performed through the website's internal search engine For it to correctly show this type of information we have to configure in our account's view and enable "Site search tracking"
-
Events: To receive information about events, we have to create it previously. We could summarize as events an action you want to measure on your website.
For example, create a call-to-action CTA and know how many clicks it has received from users who visit our website.
It's also usually used to measure video plays, calculate page scrolling, click on urls, click on contact form, etc.
Conversion report
Undoubtedly, these are the most important Google Analytics reports since they are the best indicator to know if the marketing strategies we're using are working, hey, that they make us earn money.
Conversion reports basically focus on micro and macro conversions.
- Micro conversions: those you use in a conversion funnel like, for example, a click on a button, watching a video or downloading an ebook.
- Macro conversions: occur when a user makes a complete purchase, a transaction.
Micro conversions help the user to make a macro conversion. For example, on a landing page we have a banner with a call-to-action for a product (micro), the user clicks the button, takes them to the product where they finally decide to buy it (Macro).
For conversion reports to show conversions, we must define our goals previously in Google Analytics.
How to define goals in Google Analytics?
A goal allows you to measure the activity completed by a visitor on your website or application.
Before defining a goal randomly in Google Analytics, you have to be clear about what goals you want to achieve, what actions you'll need to implement and correctly define the KPIs that will help us measure whether or not we achieve the goals we had set.
The definition of goals may vary depending on the website we have whether it's an ecommerce, a corporate website or a blog.
For example, in an ecommerce you can set as a goal knowing which is the category of products that has sold the most; in a corporate website how many users have contacted through a form; and in a blog it could be newsletter subscriptions.
For each goal we establish we must define one or more KPIs. The goals must be based on the SMART characteristics: specific, measurable, achievable, realistic and time-bound.
Example of how we define a SMART goal:
Increase sales by 10% (from €100,000 to €140,000) in the next 3 months, by running Google Ads campaigns on our products and offers to our current customers.
S: Increase sales M: 10% (from €100,000 to €140,000) A: Offering our new products and offers to our current customers R: Loyalty, increase sales. T: 3 months
How to configure goals in Google Analytics?
As an example we'll configure a basic goal:
Goal:
"I want to know how many users have contacted through the free Google Analytics analysis report form"
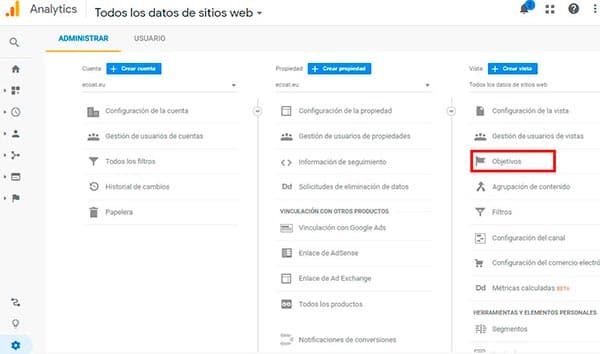
Goals are configured at view/profile level. To do this, we enter the Google Analytics administration panel.
We click on the Manage button (located in the lower left part).
Now we can visualize the Administration panel with the following options: Account, Property and View. We focus on View and we'll click on Goals:
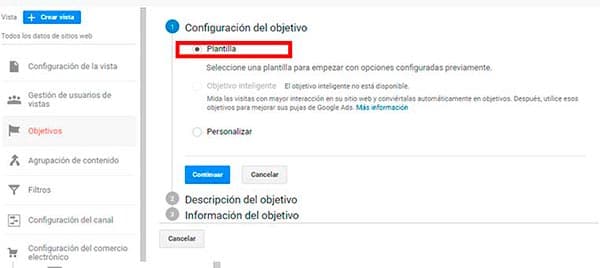
And we create a new goal:

When creating a new goal, it will appear how we want to configure our goal, whether through template or custom, in our case we'll select template:
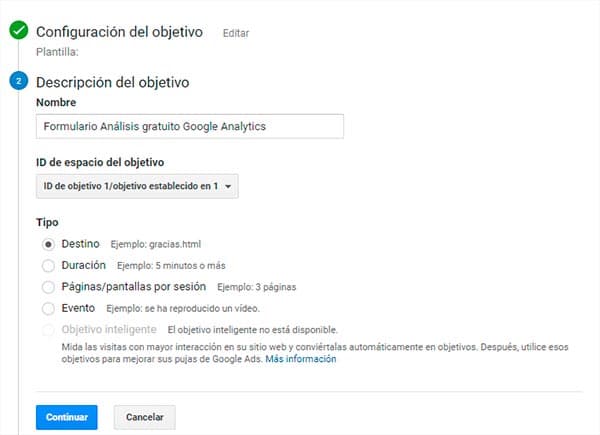
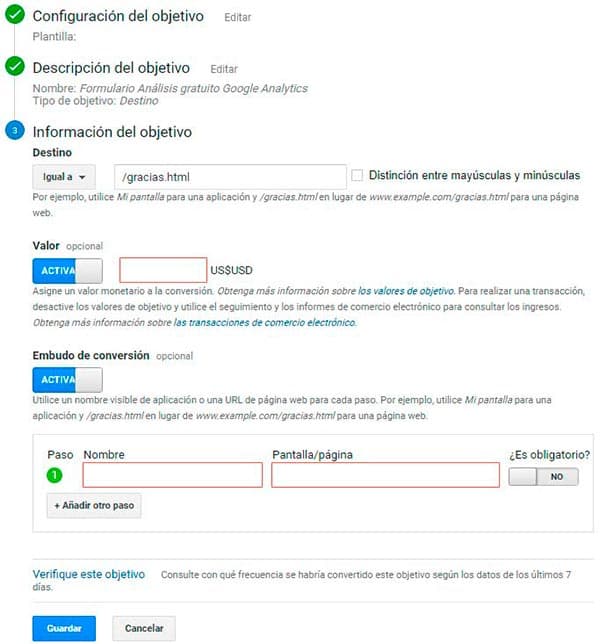
Now it's time to define the goal, in our case as an example we have put "Free Google Analytics Analysis Form". In the Type option we leave by default the Destination option and press continue.
In Destination goal information we select "equal to" although there are more options, this is the most used, choose according to your needs, then enter the "path/url " that your form redirects to, once it has performed the submission with the user's data.
In our case the form redirects to the page of "/thanks.html so we'll include this path. Finally we save.
At this point you should know what Google Analytics is, how to install it, how it works and understand what reports are for.
Do you want us at Elevam to review your website for free with the help of Google Analytics?
Count on it! Make your request, leave your data on the form indicating "Free Analytics Review" in the subject and we'll get to work.
Related reading
- How to index your website on Google
- Ranking on Google: technical, content and authority
- Best SEO agency: real criteria
Shall we work together?
If you want to apply this in your company with a team that combines technical SEO, GEO and paid acquisition measured against the income statement, request a no-commitment audit. You can also check real case studies or read the public GEO baselines that Elevam Labs publishes every quarter.