
Original human measurement, over the responses captured in the official apps.
GEO Research · Baseline T3 2026
From manual measurement to Antropus
Three ways of measuring the same baseline: manual (HSA Protocol), imported and native.
15 prompts × 3 engines (ChatGPT · Gemini · Perplexity) = 45 tests · Spain · web mode
Published24/07/2026
01 · Context and objective
From manual baselines to an automatic system
For approximately nine months, the visibility of the Elevam brand across generative AI engines has been measured through manual baselines (T1, T2 and T3), in accordance with the HSA Protocol (Human · Search · AI). This measurement is rigorous and traceable, but it is carried out by hand: prompts are launched one by one in the official apps, responses are copied manually and each test is coded by hand.
This report documents the evolution of that work toward Antropus, the tool that operationalizes the HSA Protocol and turns it into an automatic, consistent and auditable system. To do so transparently, one and the same baseline —T3— has been measured in three different ways and the results compared with one another:
Those same responses, analyzed by Antropus instead of by a person.
Antropus measuring end to end on its own, with the same prompts.
Objective
The aim is not to determine "who is right" —manual measurement is not an absolute truth either—, but to answer a more useful question: to what degree Antropus agrees with a rigorous manual measurement and what it contributes where they differ. When two independent methods measure the same thing and coincide, the measurement gains solidity; where they do not coincide, the reason is documented.
02 · Methodology of the comparison
Same material, three methods
The three methods start from the same material —the same fifteen prompts about the brand, its services and its training, distributed across six types of search intent— and differ in two variables: who scores the responses and through which channel they are obtained.
| Method | How the responses are obtained | Who scores them |
|---|---|---|
| Manual | Official apps (ChatGPT, Gemini, Perplexity), with browsing enabled | A person, in accordance with the HSA Protocol |
| Imported | The same app responses, imported into Antropus | Antropus (automatic) |
| Native | Antropus queries the engines on its own, through the API | Antropus (automatic) |
Isolation of variables
This separation into three methods makes it possible to attribute each difference to a specific cause. The comparison between the manual method and the imported one holds the data constant and changes only the evaluator (human versus Antropus), thereby isolating the scoring method. The comparison between the imported and the native one holds the evaluator constant and changes the acquisition channel, thereby isolating the measurement channel.
2.1 · Source data
The dataset consists of 45 real responses captured in the official apps of ChatGPT, Gemini and Perplexity, in web mode with browsing enabled, a new session and incognito per prompt. For each test, the exact prompt, the full response, the URLs from the sources panel, the expected canonical URL and the intent category were retained. That same material is what was imported into Antropus for the imported method. The native method reused only the fifteen prompts; the responses were obtained by Antropus on its own. Both datasets are published in full as an appendix to this report.
2.2 · The native method: the app versus the API
Unlike the manual and imported methods —which start from responses obtained in the official apps—, the native method does not use those apps: it queries the engines through their API. The API is the technical connection through which programs, not people, automatically access an AI model. Put simply, the app is the door through which a user enters and the API is the door through which tools and software enter.
It should be noted that the results obtained via app and via API will never be identical. The official app is a finished product, with its own mechanisms for searching the web, ordering sources and adapting the response; the API offers more direct access with fewer layers. Faced with the same question, each channel may show different sources: it is not that one measures well and the other badly, but rather two different routes to the same model.
This has a practical consequence. Most GEO analysis tools measure via API, since automating the apps at scale is not viable; and the API tends to show the brand's own pages less frequently, as observed in this study. For that reason, the most faithful way to reflect what a real user perceives is to import the responses from the app itself. Antropus supports both methods, so the choice is not made blindly: what matters is knowing what each one measures.
2.3 · Design differences declared in advance
Before comparing, the definitional differences between the two systems were declared, so as not to present as "error" what stems from a different criterion:
Methodological validity. Antropus excludes contaminated tests from the metrics —for example, when the response strays off topic—; manual measurement counted them.
Citation. Antropus also counts verbatim citations without a link; manual measurement required a displayed source.
Correct URL. With a declared canonical URL, Antropus requires the exact expected page; manual measurement accepted any page on the domain.
Top 3. Antropus only counts ordered rankings; manual measurement admitted unordered lists.
URL deduplication. Manual measurement counts a repeated identical URL only once. In this case the difference has no effect, since the sources panel was imported already deduplicated.
2.4 · The canonical denominator
In accordance with Antropus's methodological documentation, before calculating any metric the tests are filtered in three nested steps: produced (no technical failure), applicable (the engine responded) and visible (no methodological invalidation). The metrics are calculated over the visible tests, which constitute the canonical denominator. A provider failure or an invalid response is not counted as "the brand did not appear": it is excluded, not penalized.
In this baseline, of the 45 tests executed, the imported method leaves 42 visible (93.3% validity) and the native one also 42 visible, in its case out of 44 applicable, which places its validity at 95.5%. The tests excluded by the native method are two entity confusions —one in ChatGPT and another in Gemini— plus a provider failure in Gemini itself, which falls outside the denominator of applicable tests. For that reason the manual SoM (27/45) and Antropus's (27/42) use different denominators, despite the number of mentions coinciding.
Precision: Antropus's documentation describes a general flow that can repeat each test to average out variability. In this import, each test incorporated the single response captured manually, without repetition.


03 · The metrics of each version
Correspondence between the HSA and Antropus metrics
For transparency, it is placed on record that manual measurement and Antropus do not use exactly the same metrics. Antropus starts from those defined in the HSA Protocol and incorporates additional layers. The correspondence is as follows:
| Manual metric (HSA) | Antropus metric | What changes |
|---|---|---|
| Mention (SoM) | SoM · Mentions | Same concept; Antropus additionally verifies that the mention corresponds to the correct brand and not a homonym |
| Citation (Q) | CR · Citation | Antropus also counts text citations without a link ("according to…"), not only displayed links |
| Is there an own URL cited? | CS · Brand citation | Equivalent: whether any page of the own domain appears as a source |
| Correct URL (R) | Correct URL (R) | Antropus requires the expected canonical page for that intent (stricter criterion) |
| Top 3 | Top 3 | Antropus only counts when a genuinely ordered list exists |
| SoS / SoA | SoS / SoA | Same definition: share of own sources over the total |
| — (did not exist) | SoR · Recommendation | New: measures how strongly the AI recommends, not just whether the brand appears |
| — (did not exist) | Validity | New: discards non-measurable responses instead of counting them as absence |
| (human judgment) | Verification of doubts | New: flags as "unverified" what it cannot confirm and queries it |
Denominators declared by Antropus: SoM, CS and CR are calculated over visible tests; Top 3, over responses with an ordered ranking; correct URL, over responses with an expected canonical URL.
04 · Results: metric comparison
The final figures of the three methods
The following table gathers the final figures of the three methods over the same T3 baseline. The manual and imported columns operate over the responses captured in the apps between 23 and 25 June 2026; the native column, over responses obtained via API on 23 July 2026. The native method's figures are presented rounded to whole numbers, as in the Antropus panel; their detail with decimals appears in the attached Excel.
| Metric | Manual | Imported | Native | Denominator |
|---|---|---|---|---|
| Tests executed | 45 | 45 | 45 | — |
| Valid tests | 45 | 42 | 42 | after validity |
| Valid mentions (no.) | 27 | 27 | 23 | absolute |
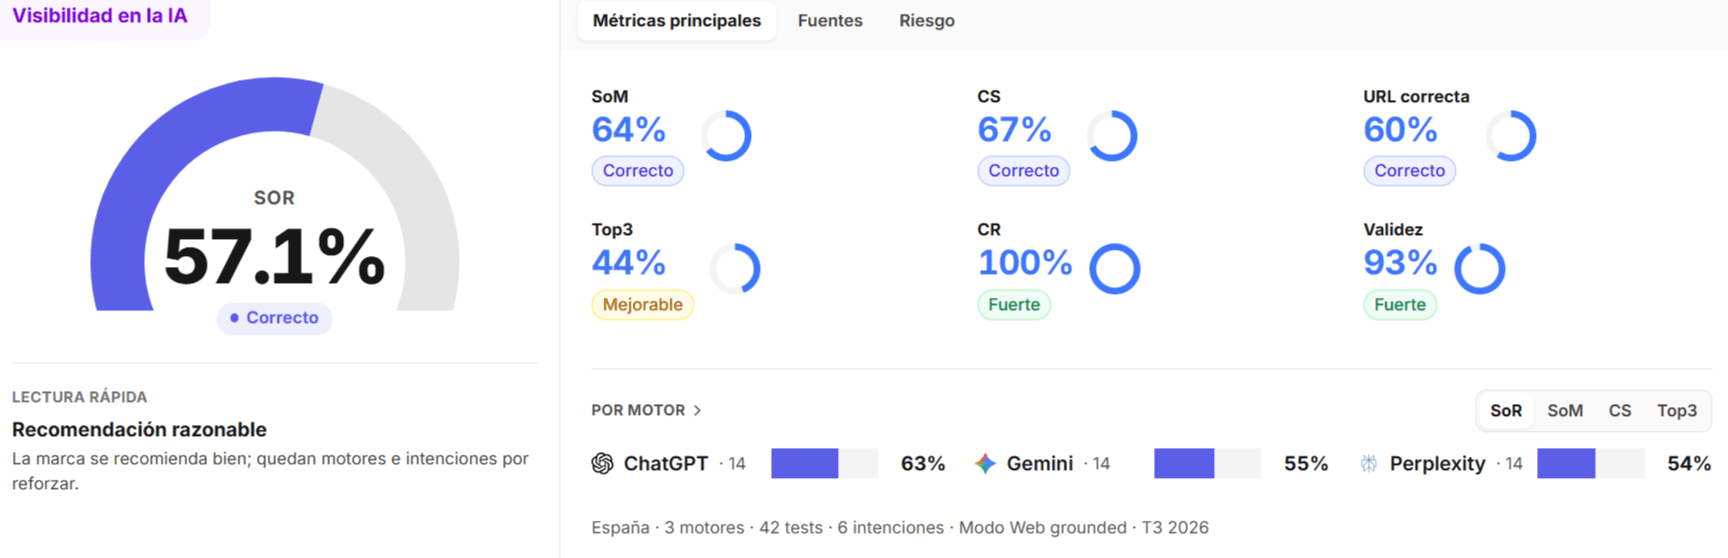
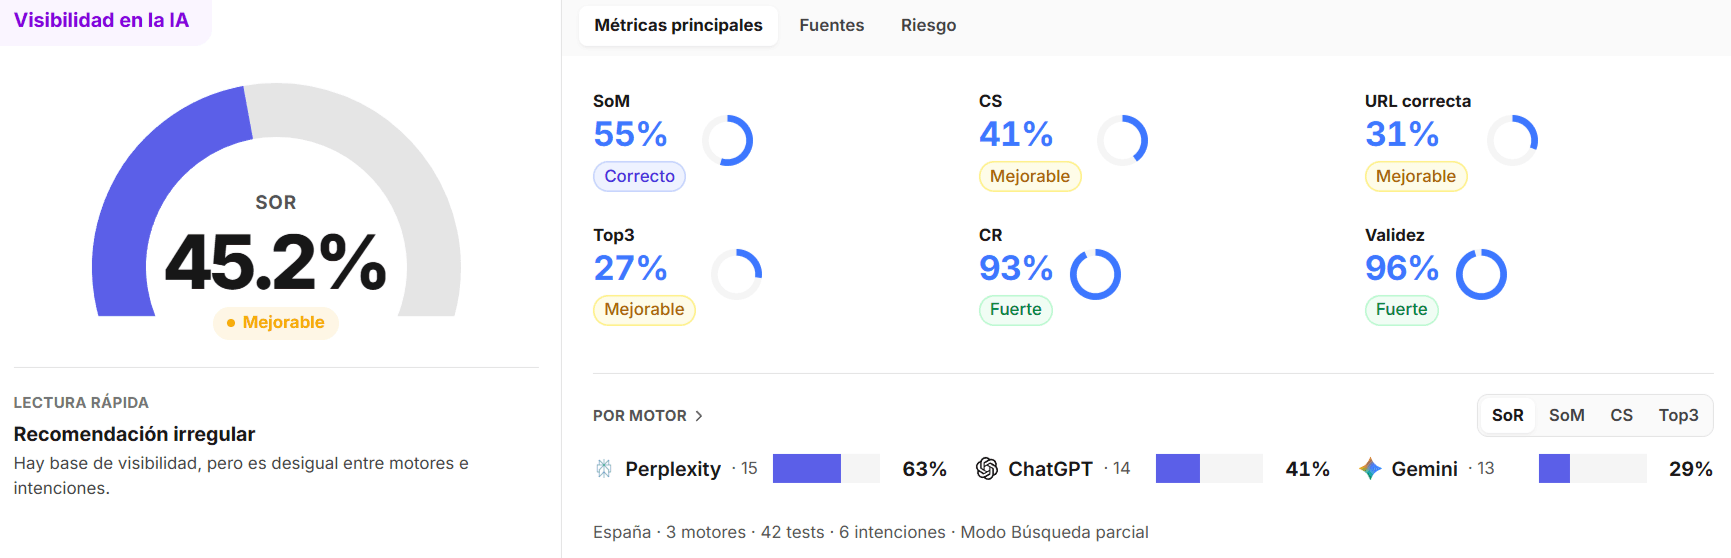
| SoM | 60.0% | 64.3% | 55% | valid tests |
| Citation (CR) | 91.1% | 100% | 93% | valid tests |
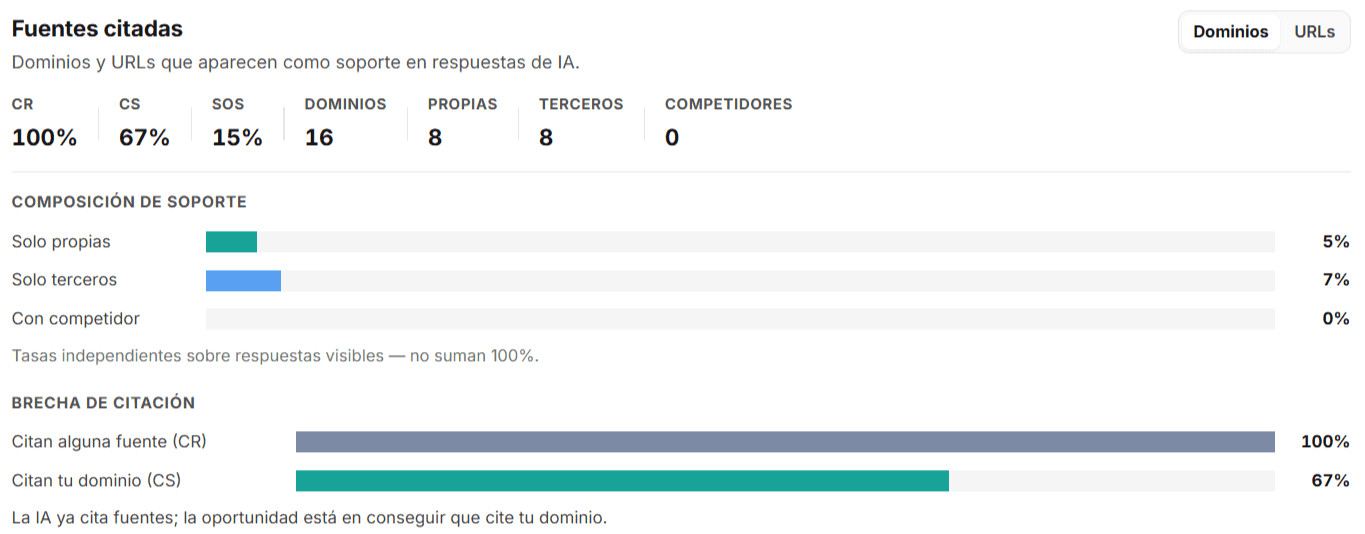
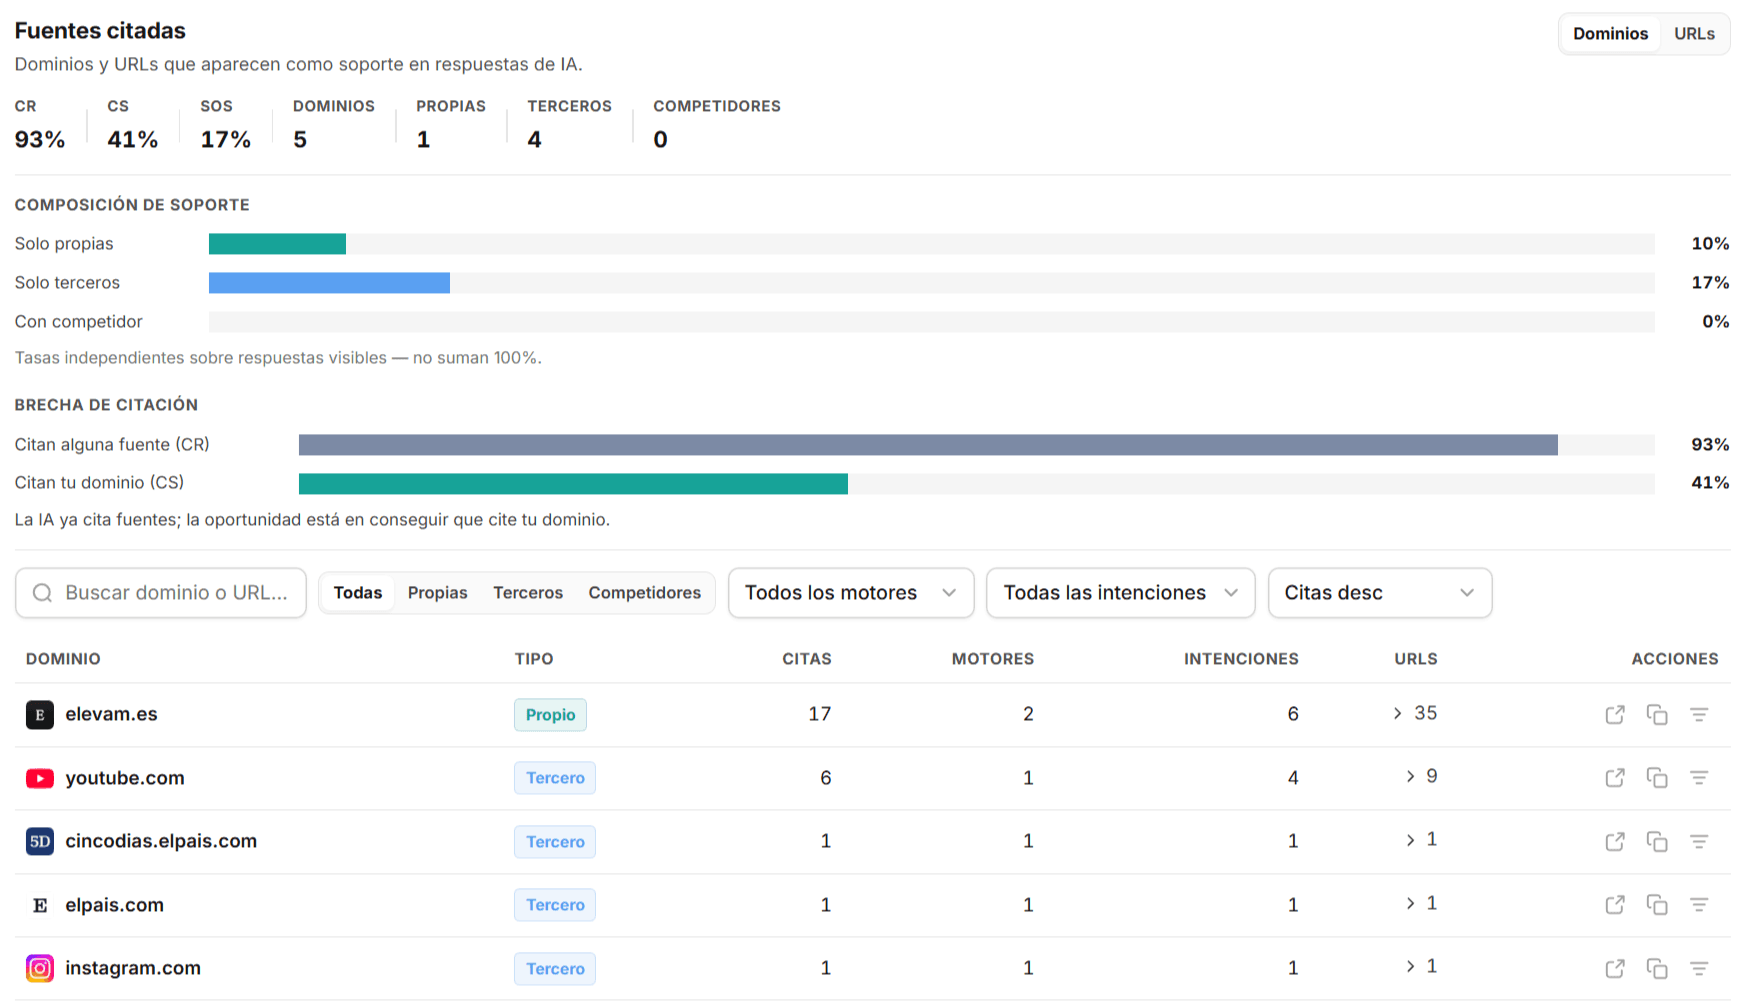
| Brand citation (CS) | 66.7%* | 67% | 41% | valid tests |
| Correct URL (strict) | — | 60% | 31% | with canonical |
| Top 3 (comparable base) | 24.4% | ≈10% | ≈7% | valid tests |
| SoS (source share) | 14.8% | 15% | 17% | total sources |
| SoR (recommendation) | — | 57.1% | 45% | with RSW measured |
| Validity | — | 93.3% | 96% | tests executed |
* The "Correct URL" metric of the manual method is functionally equivalent to Antropus's "Brand citation", as explained in "Why they do not coincide". Mentions are counted over the valid tests of each method: 27 out of 45 in the manual, 27 out of 42 in the imported and 23 out of 42 in the native. The first two columns do not share a denominator with the third, so the pertinent comparison is that of percentages, not of absolute values.
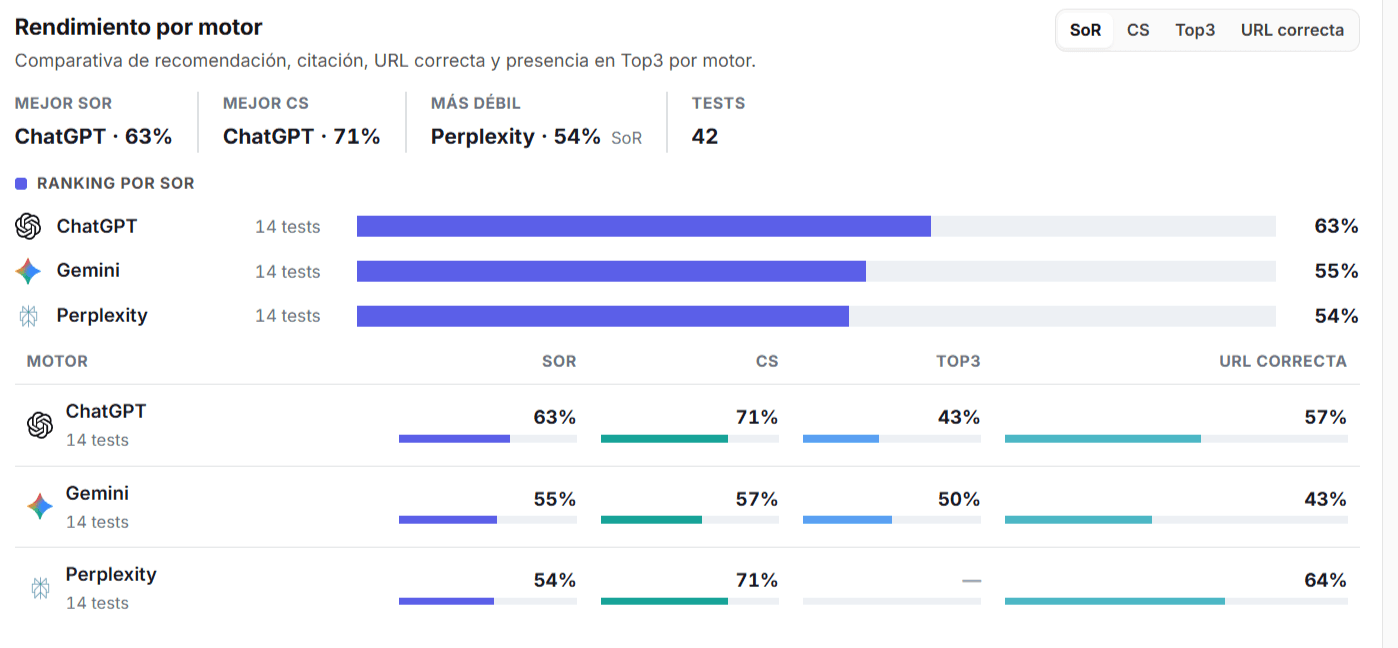
Distribution of validity. In the native method, the 42 valid tests break down into 14 from ChatGPT (93.3% validity), 13 from Gemini (92.9%) and 15 from Perplexity (100%). Top 3 is expressed over a comparable base —the total of valid tests—, since the Antropus panel calculates it over the responses that contain an ordered ranking and yields 44% in the imported method and 27% in the native one over that restricted denominator.
05 · How much does Antropus agree with manual measurement?
Manual versus imported: near-total agreement
The pertinent comparison to answer this question is the one pitting the manual method against the imported one, since both operate over exactly the same 45 responses and differ only in the evaluator. In the metrics that measure the same thing, the agreement is practically total.
| Same-concept metric | Manual | Imported | Agreement |
|---|---|---|---|
| Valid mentions (absolute no.) | 27 | 27 | 100% |
| Mentions · ChatGPT | 10 | 10 | 100% |
| Mentions · Gemini | 8 | 8 | 100% |
| Mentions · Perplexity | 9 | 9 | 100% |
| Share of own sources (SoS) | 14.8% | 15% | ≈99% |
| Brand citation | 66.7% | 67% | ≈99.5% |
Both percentages are calculated over different denominators —45 tests in the manual method and 42 in the imported one—, so they correspond to thirty and twenty-eight cases respectively. The coincidence of the percentages is, in part, an effect of that difference in base. The fully robust agreement is that of the mention count, which is compared over identical absolute figures and coincides both in the total and in the breakdown by engine.
Reading of the result
The coincidence is not limited to the aggregate: the number of mentions is identical and its breakdown by engine is too (10, 8 and 9). That two independent methods converge in this way over the same data constitutes the most solid way of attesting to the reliability of a measurement —convergent validity—. Reliability, understood as consistency and reproducibility, is not asserted: it is evidenced.
Scope of the claim
From this result it does not follow that Antropus is "more truthful" in absolute terms than manual measurement: the latter is not an infallible reference standard either. What is attested is that both methods, applied to the same data, yield the same result where they measure the same thing. Where the figures differ —correct URL, Top 3 and validity— there is no disagreement, but rather a more demanding definition or a new metric, as detailed below.
06 · Why certain figures do not coincide
Each divergence has an identifiable cause
In no case does Antropus measure with less rigor: it measures over cleaner data, with more demanding criteria, or it incorporates dimensions that manual measurement did not contemplate.
6.1 · The mention rises from 60.0% to 64.3%
Antropus detects the same number of mentions as manual measurement: 27. The percentage difference stems exclusively from the denominator, since Antropus excludes three responses that stray off topic and do not really evaluate the brand. The calculation is therefore not contaminated with invalid cases. It does not measure more: it measures over cleaner data.
6.2 · The citation rises from 91.1% to 100%
In manual measurement, only the presence of a link displayed by the engine was counted as a citation. Antropus additionally counts text citations —of the type "according to a certain source"— even if they are not accompanied by a link. Hence its figure is higher: attributions that visual review did not register are detected.
6.3 · The correct URL declines
Manual measurement considered any URL of the own domain correct. Antropus applies a stricter criterion: only the expected canonical page for that specific intent is counted as correct. If, faced with a comparative query, the engine links the contact page instead of the service page, manual measurement counted it as valid and Antropus does not. The resulting figure is lower, but also more demanding of the quality of the attribution. This distinction likewise explains why the "correct URL" of the manual method is equivalent, in practice, to Antropus's "Brand citation": both answer the question of whether the engine cites any own page. Antropus's "correct URL" constitutes a new and stricter metric.
6.4 · The Top 3 declines
Manual measurement counted the Top 3 with a flexible criterion. Antropus only counts it when a genuinely ordered list exists —first, second and third position— and the brand figures in it; an unordered enumeration does not count. It is, therefore, a stricter criterion for what constitutes a ranking.
6.5 · Metrics with no equivalent in manual measurement
Three dimensions have no counterpart in the manual method and by themselves explain part of the added value: SoR, which weighs the strength of the recommendation instead of limiting itself to recording presence; validity, which quantifies what proportion of the measurement is methodologically usable; and the verification of doubts, by which the system flags as "unverified" those claims it cannot confirm and submits them to query instead of taking them as good.
07 · The measurement channel conditions the result
Imported versus native: app vs API
The comparison between the imported method and the native one holds the evaluator constant —in both, Antropus scores— and modifies only the channel through which the responses are obtained: the official app versus the technical connection used by analysis tools. The effect on the citation metrics is pronounced.
Brand citation: from 67% to 41%. The brand appears as a source in a noticeably smaller number of responses.
Correct URL: from 60% to 31%. And when it appears, less frequently is it the appropriate page.
Recommendation (SoR): from 57.1% to 45%. The average strength with which the engine recommends the brand also decreases.
Interpretation
It is the same model queried through different channels. Through the app —as in manual measurement—, the engine cites the brand's own pages more frequently; through the API, it cites them less. The conclusion is relevant for any brand: visibility in AI depends on the channel from which it is measured. The app reflects what a real user perceives; the API, what integrations and tools perceive. Both are legitimate and answer different questions.
Methodological note: the native method was executed on a date later than the manual one, so part of the difference is attributable to the passage of time. Nonetheless, the magnitude of the drop —on the order of twenty-seven points in brand citation— points mainly to the channel.
08 · Breakdown by engine and by search type
Where the actionable information resides
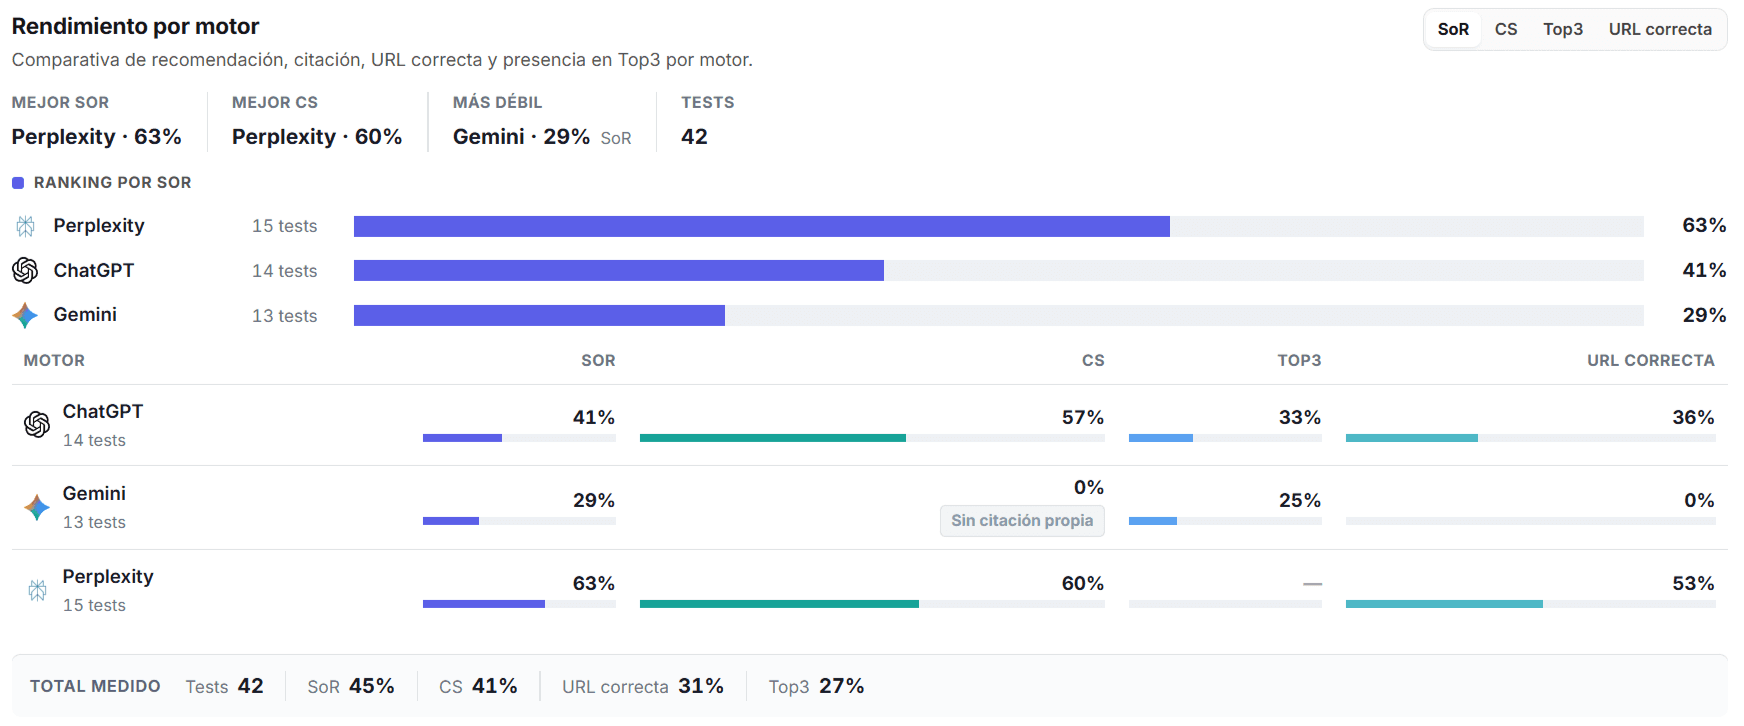
The measurement provides a level of detail that the global average conceals: the behavior of each engine and of each type of question. The figures in this section come from the native method (measurement via API). They should be read in light of the above: the technical connection attributes less brand citation than the official app, so these percentages represent the floor of visibility —what integrations and analysis tools perceive—, not the ceiling. The relative diagnosis between engines and between intents remains valid, since all the figures were obtained through the same channel.
8.1 · By engine
| Engine | SoR | Brand citation | Correct URL | Validity |
|---|---|---|---|---|
| Perplexity | 63% | 60% | 53% | 100% |
| ChatGPT | 41% | 57% | 36% | 93% |
| Gemini | 29% | 0% | 0% | 93% |
Perplexity is the strong point: it cites pages of the own domain in three out of five responses and, in more than half, the correct page.
ChatGPT cites, but gets the page wrong: it references the own domain in more than half of the responses, though in most cases it does not link the appropriate page for the intent queried.
Gemini mentions the brand but does not cite its pages: it recommends it to some extent, though it does not cite the own domain in any response; the sources it shows are third parties that talk about the brand.
8.2 · By search type
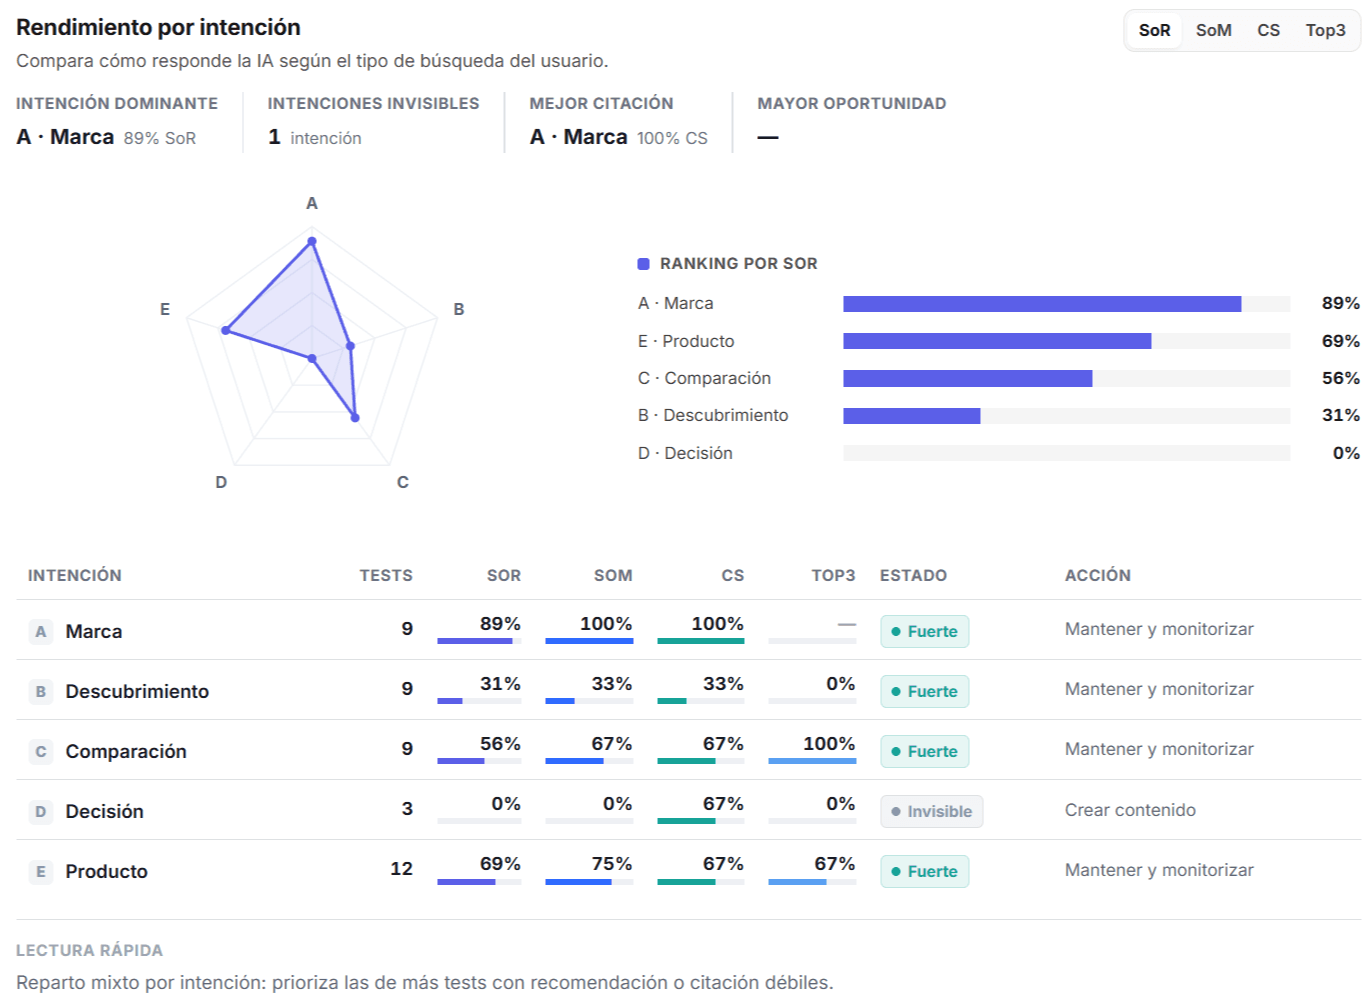
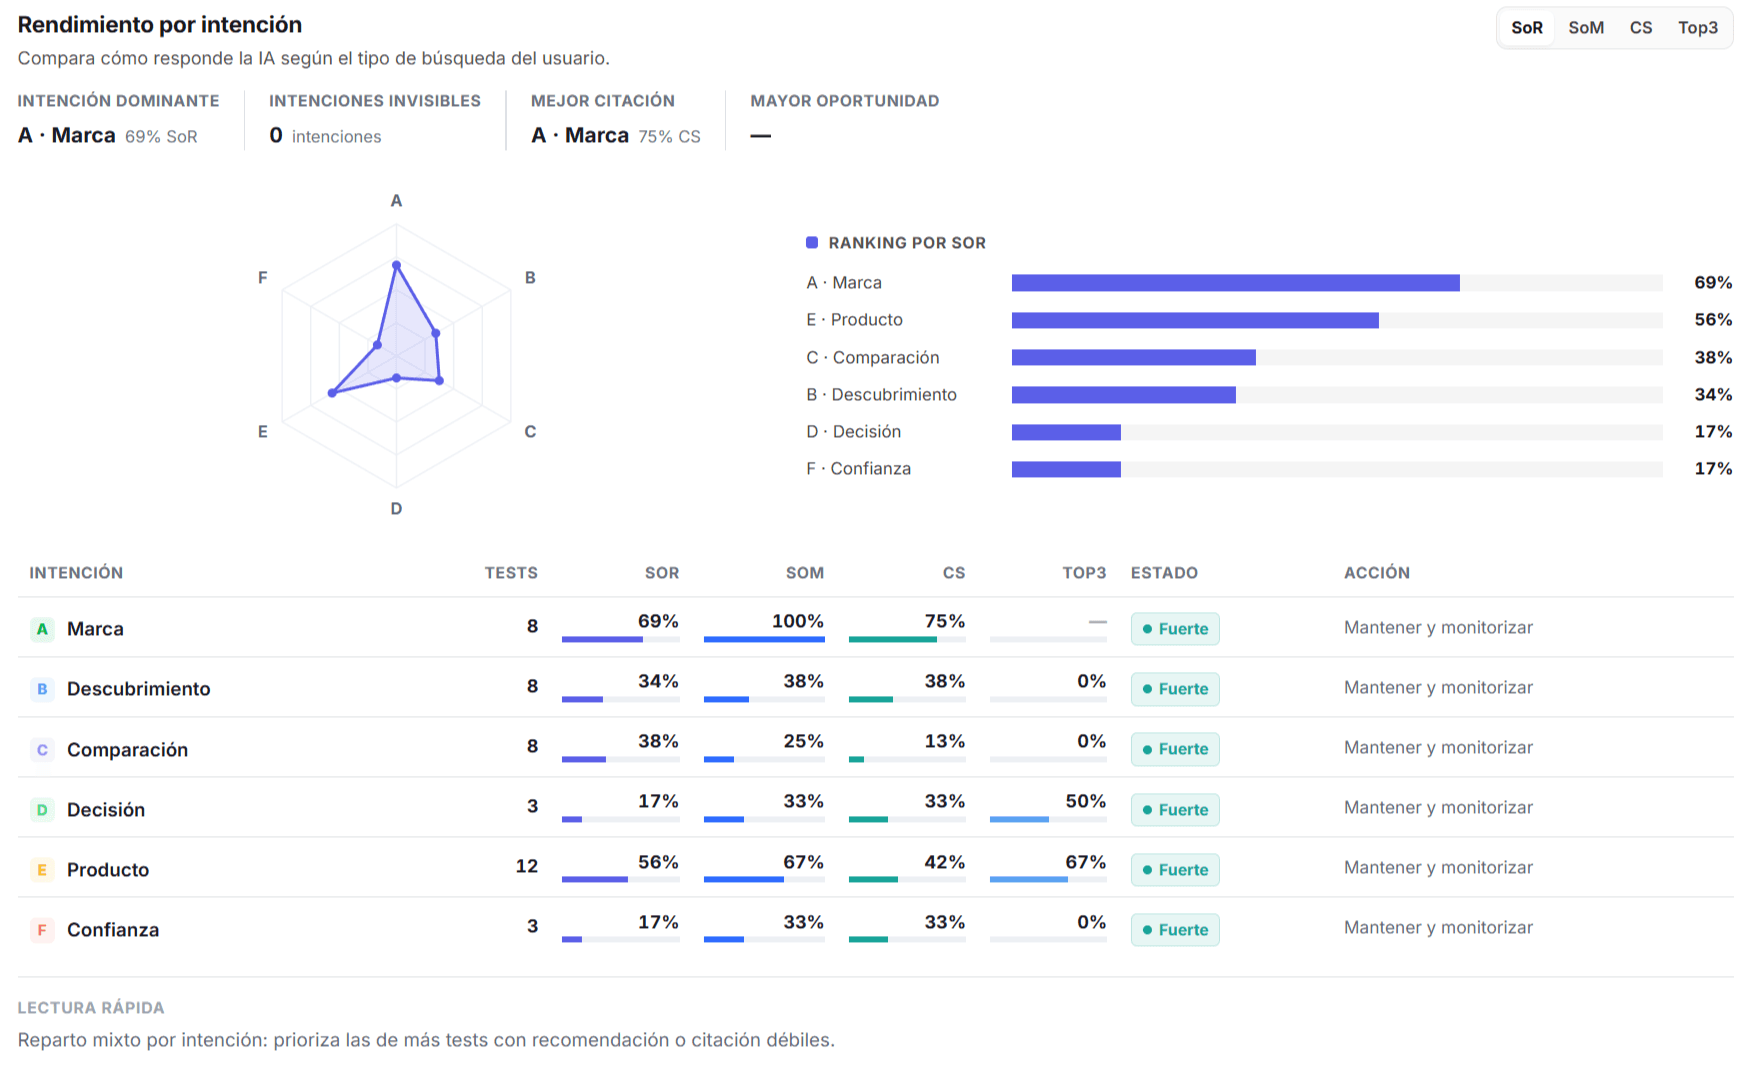
Disaggregating by user intent reveals the pattern of greatest commercial relevance: the brand obtains good results when the query is about itself or its training, and loses presence when the user compares or decides without prior knowledge of it.
| Search type | SoR | Mention | Brand citation |
|---|---|---|---|
| Brand | 69% | 100% | 75% |
| Product (training) | 56% | 67% | 42% |
| Discovery | 34% | 38% | 38% |
| Comparison | 38% | 25% | 13% |
| Decision | 17% | 33% | 33% |
| Trust | 17% | 33% | 33% |
Diagnosis
When the user already knows the brand or searches for its training, it appears solidly (SoM of 100% and 67%, respectively). When they compare agencies without prior knowledge of it, on the other hand, it falls to the lowest point of the journey: it is mentioned in barely one out of four cases (SoM 25%) and rarely cites the own domain (13%). It is precisely "Comparison" —the stretch in which the user evaluates options before contracting— where the greatest loss of presence is concentrated.
09 · From measurement to action
The same plan, generated automatically
Antropus does not limit itself to measuring: from the results it generates a prioritized diagnosis. Over this baseline, 44 incidents grouped into 7 patterns were identified, headed by the absence of own sources —the brand is cited, but no own URL backs it— (8 cases), the lack of activation of the brand in its category (8 cases) and exclusion from the comparative shortlist (6 cases), followed by canonical deviation (4 cases) and entity confusion (2 cases). From that diagnosis a plan of eight actions is derived with a target metric and quantified success criteria for the next measurement: the first, operational in nature, consists of repeating the single test that Gemini did not complete due to a technical provider failure; the remaining seven are strategic.
The most relevant finding of the study is that this plan, generated automatically, coincides with the actions derived manually after the human analysis of the T3 baseline.
| Priority | Manual (T3) | Imported | Native |
|---|---|---|---|
| Create comparative content | |||
| Generate citable own evidence | |||
| Reinforce the correct canonical pages | |||
| Investigate the competitors occupying the recommendation | |||
| Build a roadmap / next measurement | |||
| Clarify the acronyms and the brand entity |
The tactical detail varies according to what each measurement detected: the manual study stressed the literal expansion "GEO = Generative Engine Optimization" and the disambiguation of HSA; the imported method prioritizes schema.org markup; the native one, resolving the acronym ambiguity that arose in its responses. The strategic direction, however, is identical in all three.
Triple confirmation
The correspondence is not an isolated case. The plans of the imported method and the native one —both generated by Antropus, but over different data— in turn coincide in their main priorities. The same strategic plan therefore emerges from the manual measurement, the imported one and the native one. It is not a recommendation born of chance nor of a single measurement, but a stable direction that holds regardless of how it is measured.
9.1 · The cost of obtaining that diagnosis
The operational difference between the two methods is substantial. Manual measurement requires opening each app, launching the fifteen prompts one by one in a new session, copying the full responses, recording the URLs from the panel, deduplicating them and coding by hand the metrics of each of the 45 tests; to which the protocol itself adds a double review of hallucinations, correct URL and cases of citation without mention before considering the measurement closed. In practice, completing a baseline by this procedure requires approximately three working days, at a rate of one engine per day.
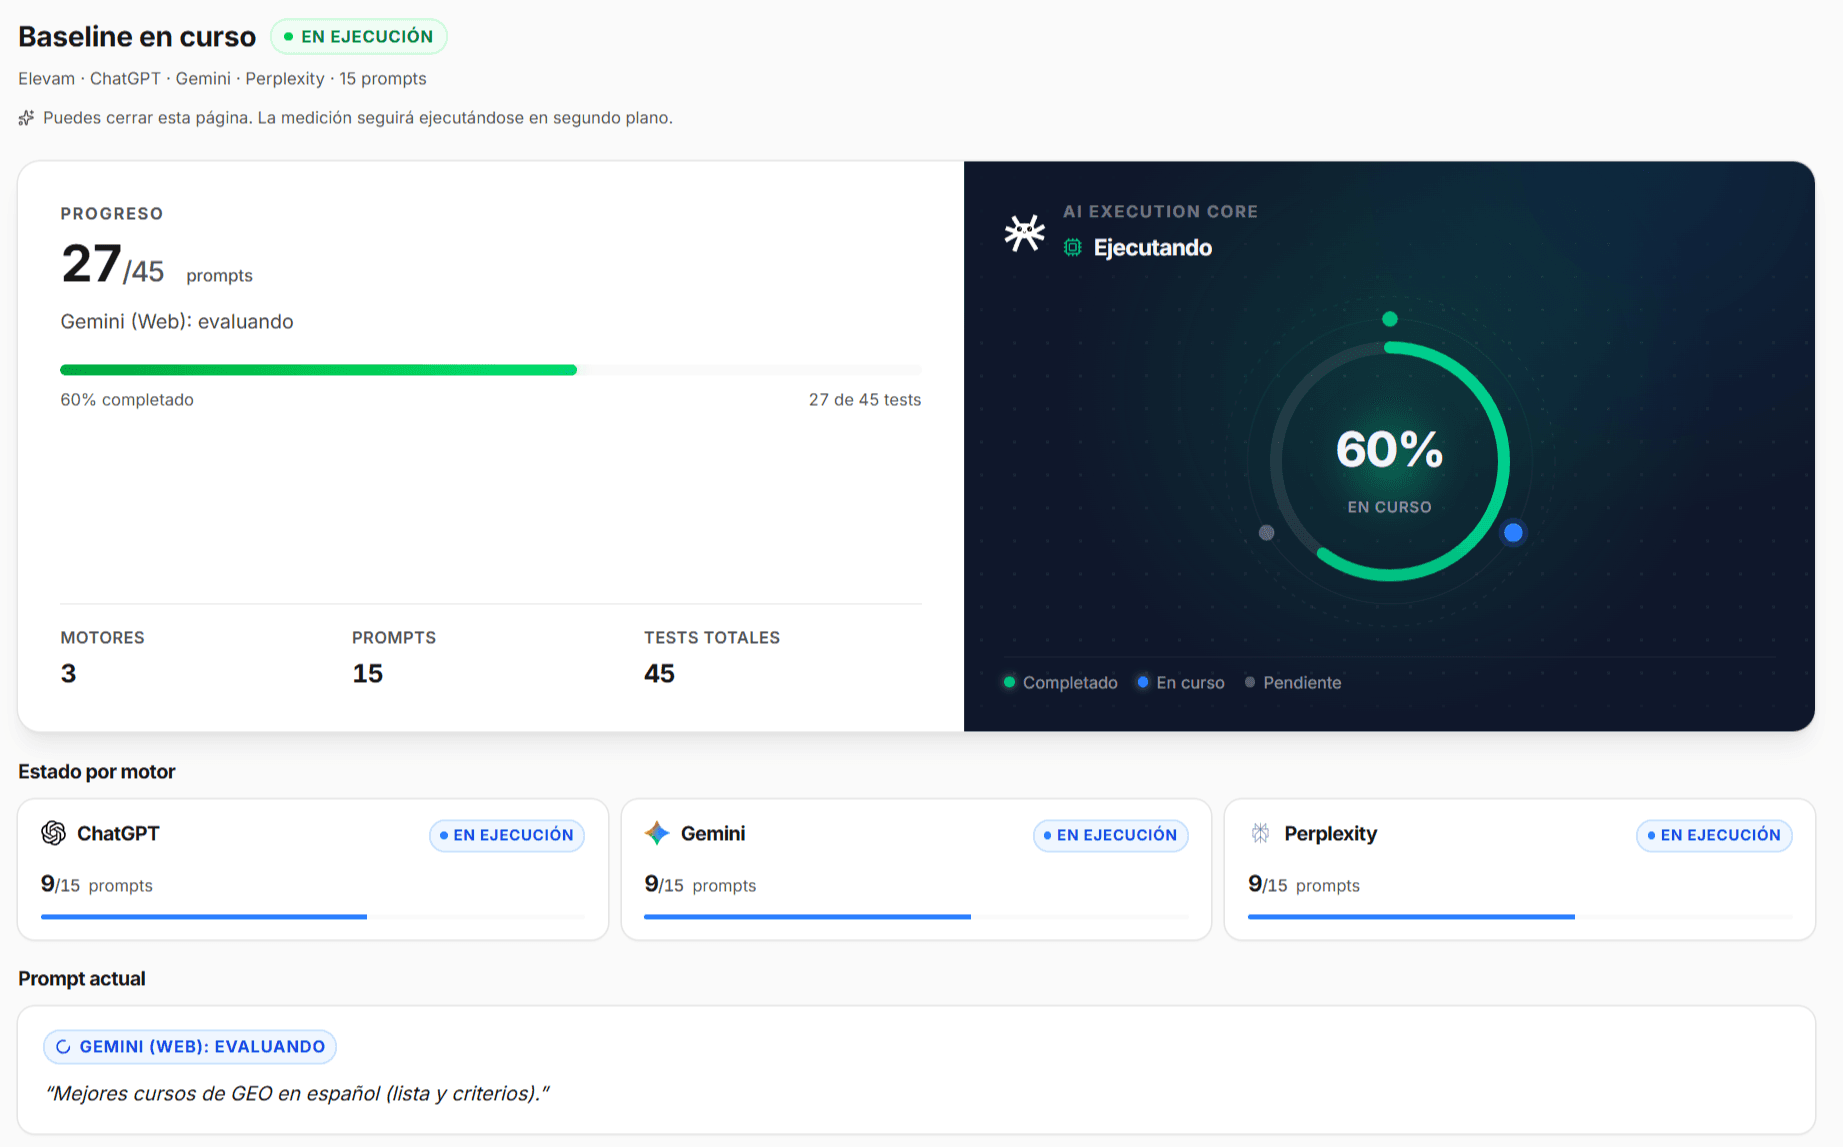
The native method completed those same 45 tests, across the three engines, in approximately 45 minutes and without human intervention, additionally delivering the breakdown by engine and by intent and the prioritized action plan.
The scope of the savings in each method should be specified. The imported method retains the manual capture of responses —since its value lies precisely in gathering what the app shows the user— and automates only the coding and analysis. The native method automates the complete process, capture included. In both cases the variability of human coding and the methodological control work that the manual method must incorporate as an additional task are eliminated.
Expressed in operational terms, a measurement that took three days of specialized work is resolved in less than an hour. That leap not only reduces cost: it enables a measurement frequency that the manual method makes materially unviable, and which is precisely the one that allows reliable time series to be built.


10 · When each method is appropriate
Two legitimate methods for different questions
Both methods are legitimate and answer different questions. The choice should not be made by default, but according to the objective of the measurement.
10.1 · When the imported method is appropriate
When the objective is to know what a real user perceives. The responses come from the official app, the environment in which the potential client makes their queries.
When fidelity prevails over frequency. Audits, management reports or client presentations in which reflecting the real experience is decisive.
When captured responses are already available. It allows previous measurements —including manual ones— to be leveraged and scored with a homogeneous and auditable criterion.
When one wishes to avoid the bias of the technical channel. Since the API tends to show own pages less, the imported method avoids underestimating real visibility.
Limitation: it requires manual capture of the responses, so it does not scale to frequent measurements or ones with a large volume of prompts.
10.2 · When the native method is appropriate
When frequency and scale are required. Periodic monitoring, high volumes of prompts or continuous monitoring without human intervention.
When analyzing evolution over time. By always keeping the same channel and the same criteria, the time series are comparable with one another.
When a diagnosis and action plan are needed quickly. The breakdown by engine and intent and the prioritized plan are obtained in minutes.
When the channel used by tools and integrations is of interest. It is the surface that automatic systems consume, and it also deserves to be measured.
Limitation: it measures the API channel, which may yield a citation of the own domain lower than that perceived by a user in the app.
10.3 · Recommended criterion: combined use
The most solid approach does not consist of choosing one method, but of combining them with differentiated functions: the native method as periodic monitoring measurement —for its capacity to repeat frequently and under homogeneous conditions, which allows a trend to be built— and the imported method as point-in-time validation at the relevant milestones, to contrast that trend with the real user experience in the app.
Applied to a usual work cycle: native monitoring with the periodicity the project requires, and one imported measurement per quarter —coinciding with the close of the baseline— acting as a calibration point. In this way scale and fidelity are obtained simultaneously, and it is known at all times what each figure measures.
11 · Conclusion
Three conclusions on one and the same baseline
The study attests, over one and the same baseline measured in three different ways, three conclusions:
Antropus is reliable
Where it measures the same thing as manual measurement, it coincides practically totally: identical number of mentions, identical breakdown by engine and equivalent source share. It is convergent validity between two independent methods.
Antropus measures with greater rigor and greater detail
It discards invalid responses, requires the correct canonical page, distinguishes the behavior of each engine and each type of search, and weighs the strength of the recommendation in addition to mere presence.
Antropus translates measurement into action, automatically
The improvement plan it generates coincides with the one a human team derived after days of analysis, and it is obtained in minutes.
Antropus measures a brand's visibility in AI with the same criterion as a rigorous human analyst —automatically, consistently and auditably— and does not stop at the data: it indicates what must be done to improve it.
Scope and limits
Manual measurement does not constitute an absolute truth, so it is not asserted that Antropus is "more truthful" in absolute terms, but rather that it agrees with it where they measure the same thing and surpasses it in rigor and detail where they differ. The system itself makes its limits explicit —it flags what it cannot verify, distinguishes the non-measurable from what is measured at zero and does not infer what has not been declared—. That transparency is what sustains its credibility as a GEO analytics tool.
Appendix · Datasets
Data for full verification
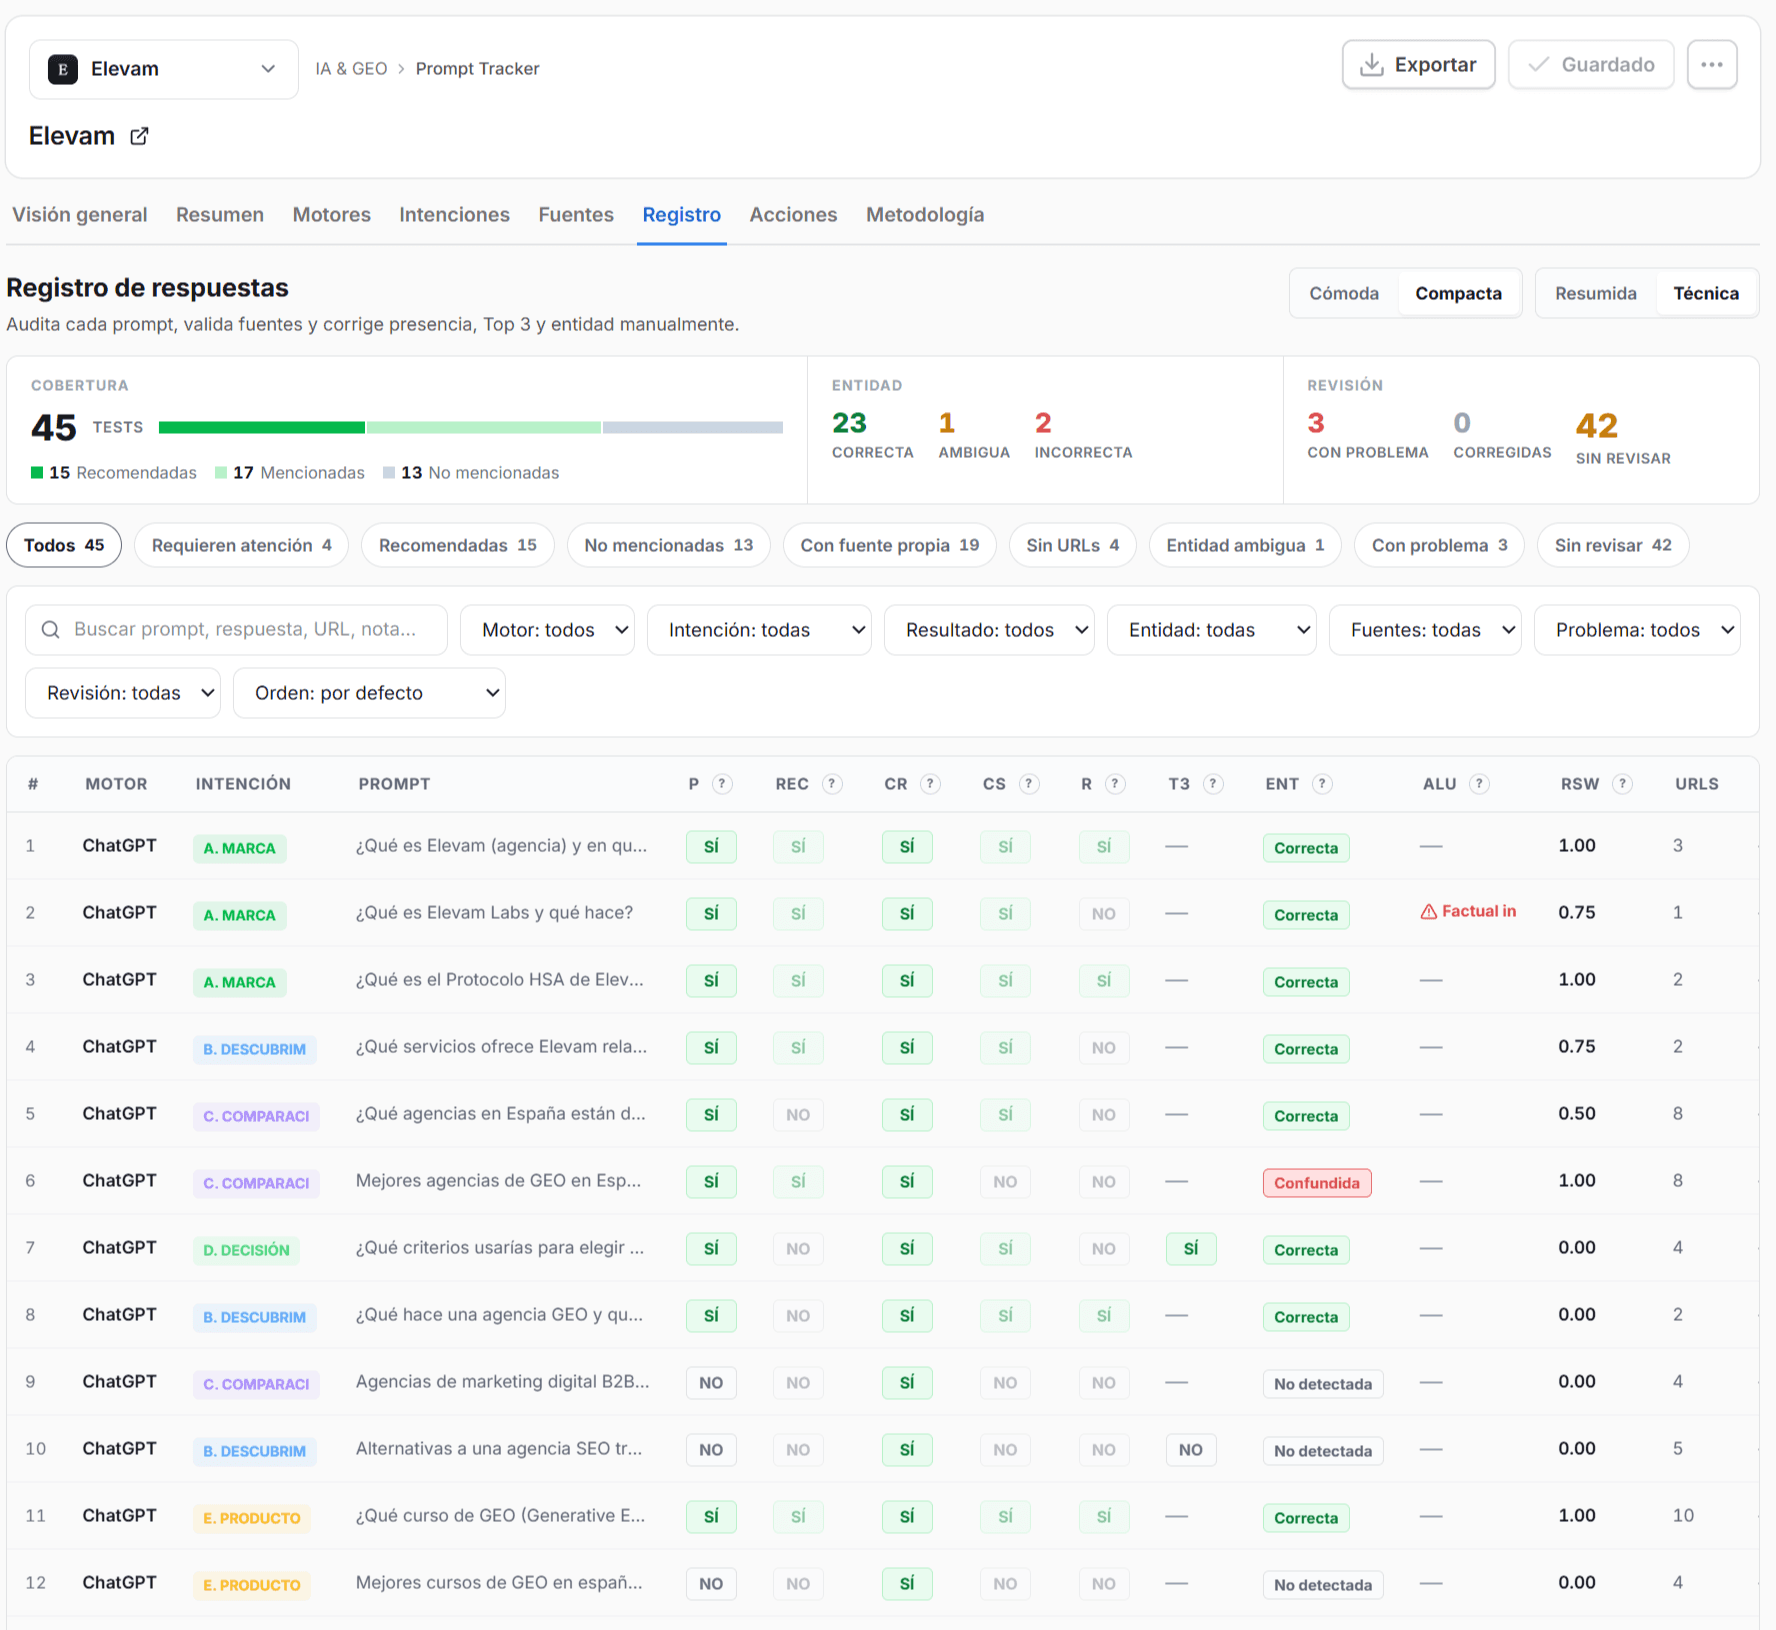
In order to allow full verification of the results, the two datasets used in this report are published:
Imported source data
Real responses captured in ChatGPT, Gemini and Perplexity and imported into Antropus, with the prompt, the full response, the cited URLs, the expected canonical URL and the intent category of each test.
baseline-manual-T3-import-antropus.xlsx· 123 KBNative baseline log
Technical detail of the 45 tests analyzed by Antropus, with the complete coding of each response and the aggregates by engine and by intent.
Baseline_Elevam_T3_Baseline_Nativo_2026_v1.1.xlsx· 89 KBThe native method file contains the complete coding by test, so it allows the figures of that column to be fully recalculated. The import file gathers the input data —prompt, response, cited URLs, canonical URL and category—, that is, the exact material that was submitted for evaluation, but not the resulting coding; the manual and imported columns are therefore not recalculable from this appendix.
Dataset license: Creative Commons Attribution 4.0 International (CC BY 4.0). You may share and adapt the data, including for commercial purposes, crediting Elevam and linking to the original study. View the license terms